Single-Rollout Asynchronous Optimization for Coding Agents: Practice in Lego-RL
TLDR
Can one attempt per task provide enough signal to train a coding agent? In Lego-RL, Single-Rollout Asynchronous Optimization (SAO) improves Qwen3.5-35B-A3B using a learned critic instead of a group of repeated attempts.
On OpenSWE, SAO reaches 68.6% on SWE-bench Verified, up from 64.0%, using 74% fewer reported trajectories to its own best checkpoint than GSPO. GSPO reaches a higher 70.4%. Further SAO applications reach 57.0% and 61.67% on SWE-bench Multilingual.
The practical lesson: warm-start and warm up the critic, whiten advantages, and watch how values change across an agent’s turns.
Why train with one rollout per task?
A coding-agent rollout can involve dozens of repository searches, edits, and test runs. Repeating that process eight times for the same task is expensive—and the slowest attempts delay the group’s learning signal.
GRPO computes advantages from rewards within each prompt group. Our GSPO baseline uses these GRPO-style advantages, with sequence-level policy ratios. Asynchronous generation lets other work continue, but the group dependency remains; waiting also makes completed trajectories older relative to the current policy.
SAO replaces the group baseline with a learned critic. Token-level generalized advantage estimation (GAE) supplies the learning signal, allowing one rollout per task. Direct double-sided importance sampling handles policy mismatch by masking tokens whose current-to-rollout probability ratios fall outside a prescribed interval.
| Component | GRPO | GSPO baseline | SAO recipe |
|---|---|---|---|
| Advantage baseline | Rewards within a prompt group | GRPO-style group-relative advantages | Learned value function with GAE |
| Samples per task in the compared settings | 8 | 8 | 1 |
| Policy weighting | Token-level ratio in the standard objective | Sequence-level ratio | Direct token-level importance sampling with masking |
| Learned critic | No | No | Yes |
| Group completion needed for the usual advantage estimate | Yes | Yes | No |
Sample counts describe the compared settings, not algorithm requirements. One rollout per task still allows many tasks in a batch.
The cost shifts toward value learning: our recipe freezes the critic’s attention parameters and uses two critic optimization epochs per actor update. GAE skips tool-observation tokens, while the model still sees them as context.
How does SAO compare with GSPO?
In our comparison, we train Qwen3.5-35B-A3B Instruct on 2,699 OpenSWE tasks through OpenHands SDK, using fully asynchronous training on the same machines. GSPO samples eight rollouts per task; SAO samples one.
Benchmark performance
SAO improves all three benchmarks over the base model. GSPO leads on Verified; Pro and Multilingual scores are closer.
| Training recipe | SWE-bench Verified | SWE-bench Pro | SWE-bench Multilingual |
|---|---|---|---|
| Qwen3.5-35B-A3B Instruct | 64.0% | 39.8% | 51.7% |
| GSPO, OpenHands SDK | 70.4% | 42.3% | 55.33% |
| SAO, OpenHands SDK | 68.6% | 42.1% | 56.0% |
| SAO − GSPO | −1.8 pp | −0.2 pp | +0.67 pp |
Table 1. Resolved tasks through OpenHands SDK. “pp” denotes percentage points; small differences need repeated evaluations.
Sampling cost and time to quality
SAO reaches its best checkpoint with 12.8k reported trajectories, versus 48.6k for GSPO. That is a 73.7% reduction, although the two checkpoints have different scores.
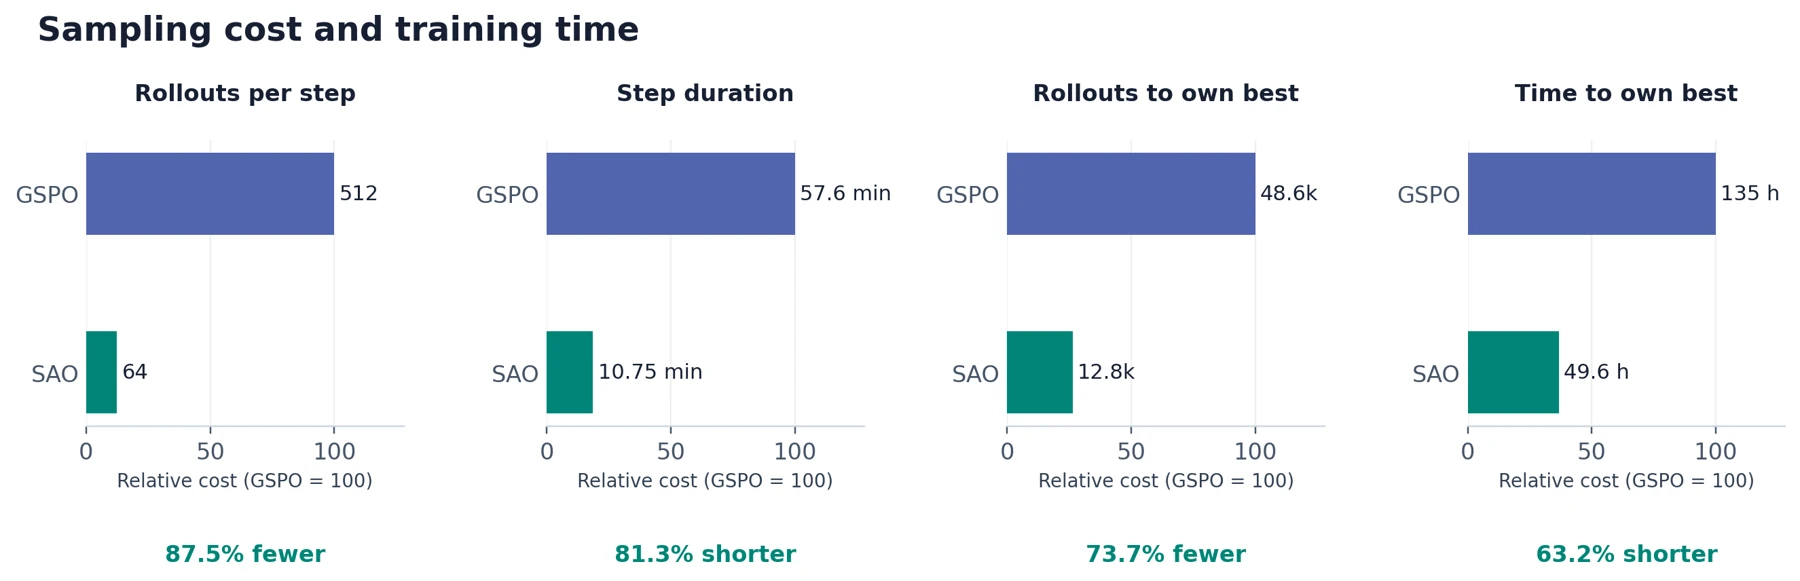
Figure 1. Costs relative to GSPO = 100. Best-checkpoint panels compare each recipe’s own optimum.
SAO’s displayed step duration is 5.36× shorter, but it processes 64 rollouts per step versus GSPO’s 512. This ratio is not a per-trajectory throughput gain. A shared validation threshold gives a more useful quality comparison:
| Recorded event | GSPO | SAO |
|---|---|---|
| First recorded score ≥68% | 68.8% at step 50 | 68.2% at step 180 |
| Concurrency-normalized time to that evaluation | 64.1 h | 44.3 h |
| Best recorded score | 70.4% at step 95 | 68.6% at step 200 |
| Concurrency-normalized time to own best score | 135 h | 49.6 h |
Table 2. Recorded checkpoints; GSPO evaluates about every five steps and SAO every twenty.
SAO first records ≥68% 19.8 hours earlier on the normalized time axis. The time comparison assumes linear concurrency scaling, includes restart gaps and discarded work, and excludes earlier critic-initialization training. Different evaluation cadences limit its precision.
What changes in agent behavior?
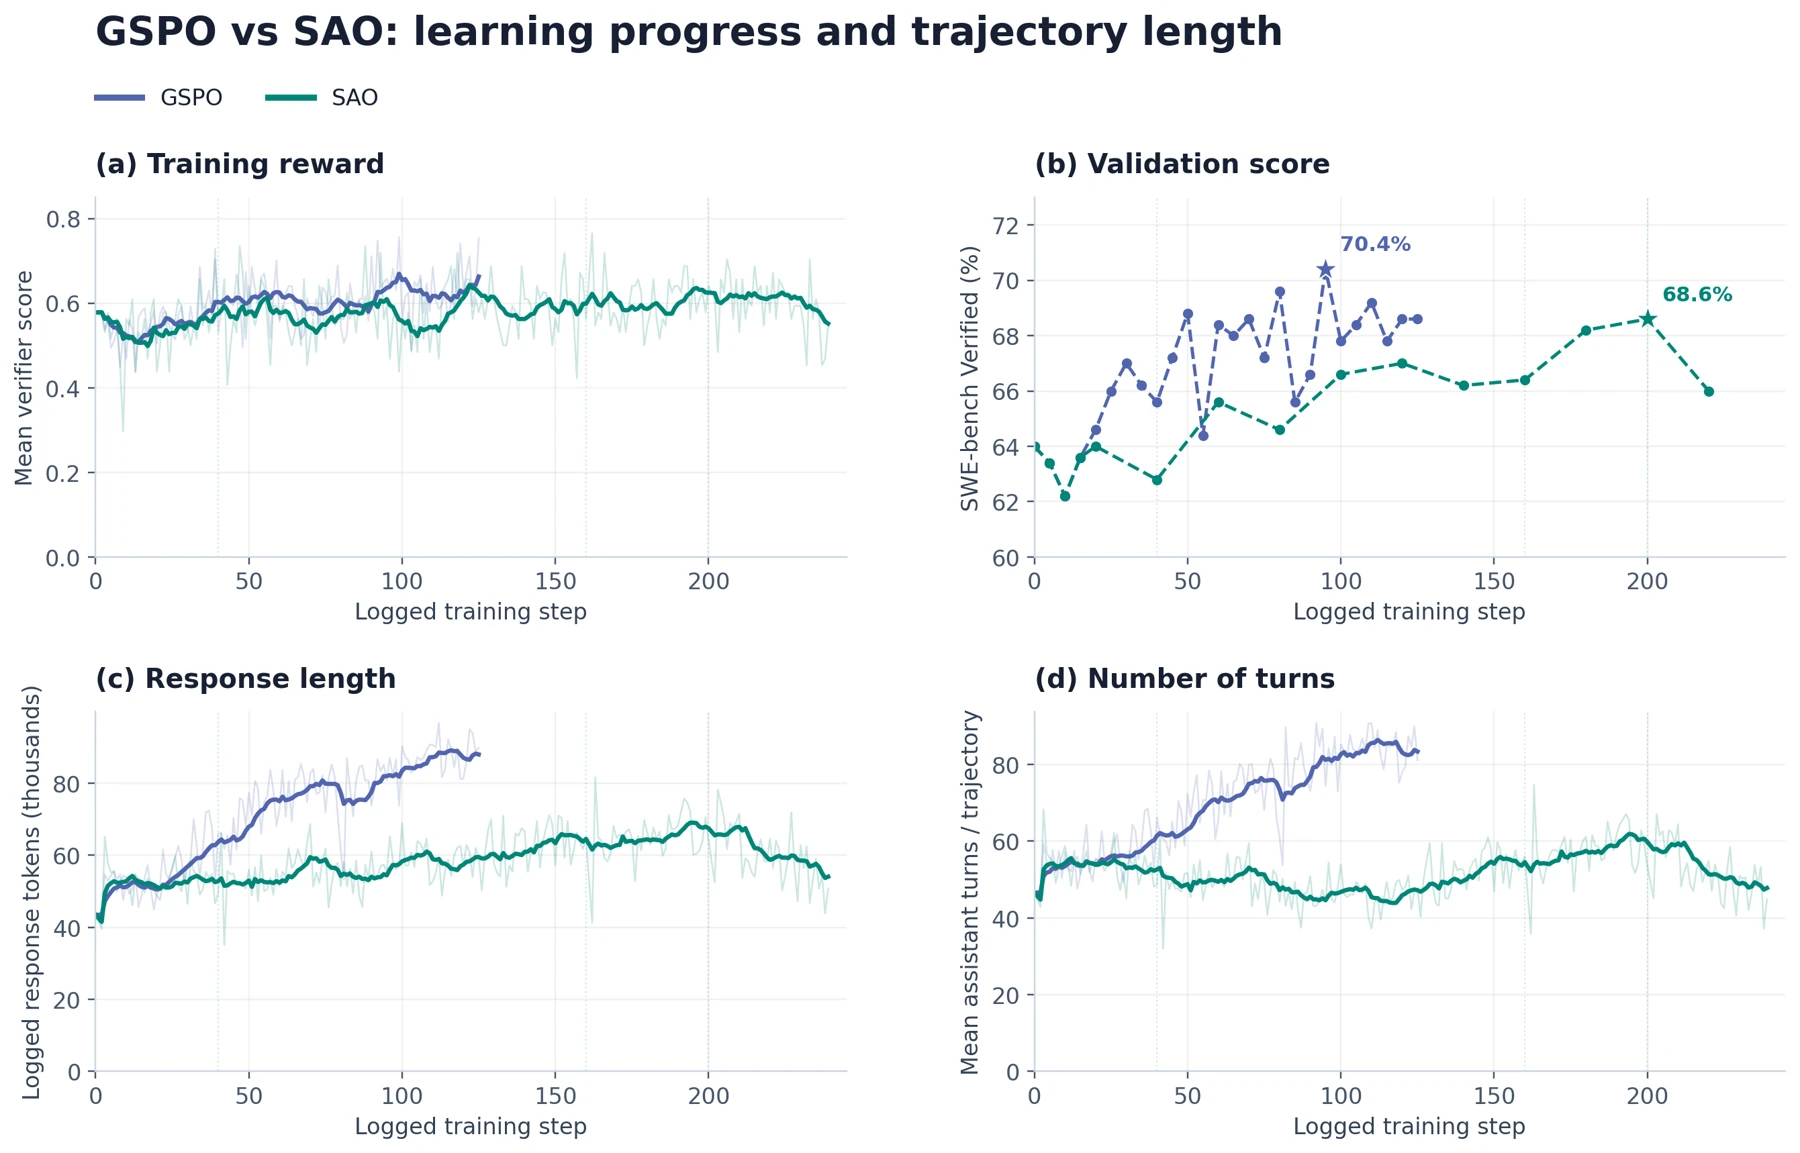
Figure 2. Reward, validation, response-span length, and assistant turns. Training curves use continuous ten-point means; validation is unsmoothed. SAO sessions retain the latest continuation. Shared starts and GSPO-supplied fills are display references, excluded from statistics.
Both recipes improve reward, but their trajectories evolve differently. GSPO produces longer interactions with more turns; SAO’s length grows modestly while its turn count falls.
| Metric | GSPO: first 20 → last 20 | SAO: first 20 → last 20 |
|---|---|---|
| Training reward | 0.533 → 0.638 | 0.521 → 0.581 |
| Response-span length | 51.3k → 88.4k tokens | 52.2k → 56.4k tokens |
| Assistant turns | 54.2 → 84.4 | 54.5 → 48.5 |
Table 3. First and last twenty observed training points, excluding plotting fills. Training budgets differ; response spans can include tool observations.
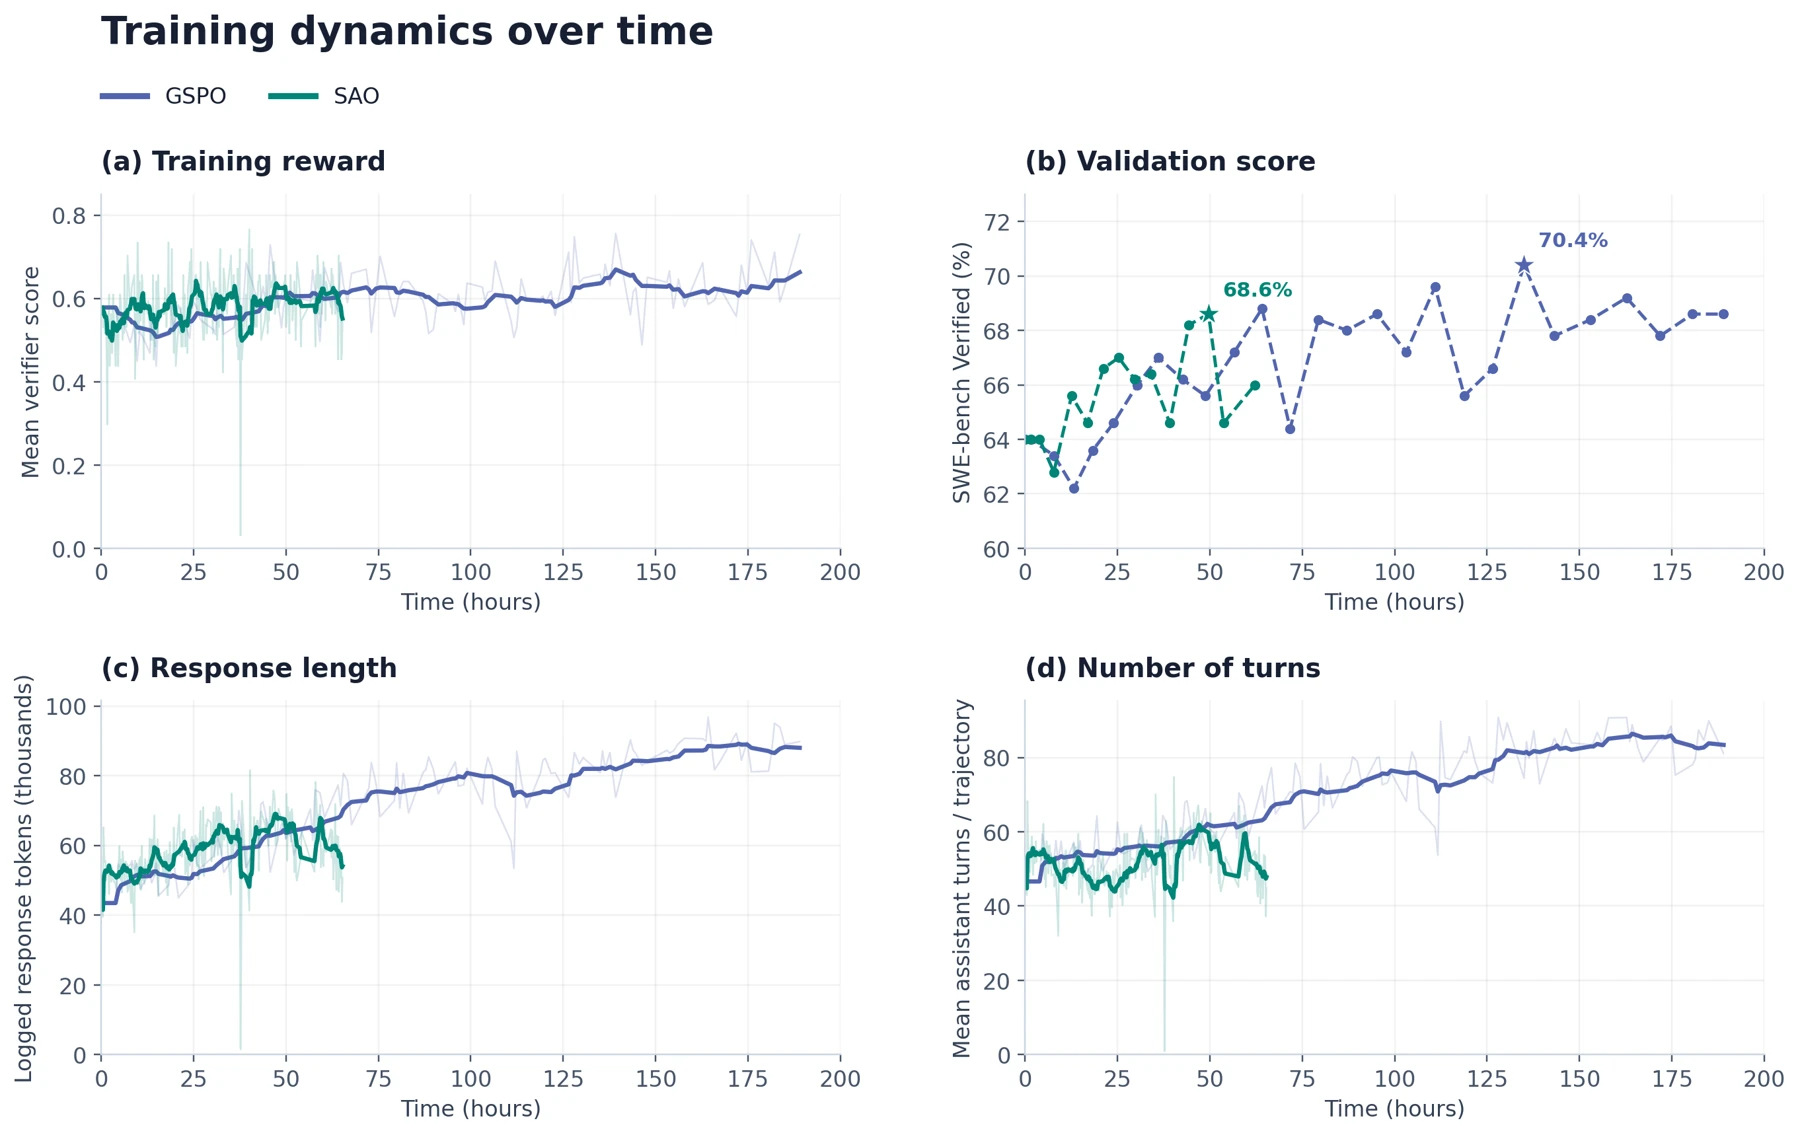
Figure 3. The same metrics over normalized time, including all SAO attempts and restart gaps. Display references follow Figure 2.
SAO reaches the shared threshold earlier under the stated scaling; GSPO retains the higher best Verified score. Neither finishes at its best checkpoint. The behavior curves also show why validation and reward should be read alongside length and turns.
What makes SAO work?
A useful critic must be in place before its estimates drive actor updates. Our stabilized recipe combines critic warm start, warmup, advantage whitening, and a higher critic gradient-clipping threshold. These changes were tested together, so the comparison supports the combined recipe rather than an isolated component.
Warm-start and warm up the critic
A warm start reuses a trained value model; warmup recalibrates it on the starting actor’s rollouts before policy updates begin. We retain the base actor, initialize the critic from an earlier trained checkpoint, increase warmup from 10 to 20 steps, and raise critic gradient clipping from 1 to 10.
At common steps 40–100, mean critic explained variance rises from 0.034 to 0.272. Giving the critic time to learn also requires optimization settings that permit meaningful updates.
Whiten the advantages
Set GAE_WHITEN_ADVANTAGES=True to center and scale policy advantages over valid model-action tokens:
A_whitened = (A_raw − mean_masked(A_raw)) / sqrt(var_masked(A_raw) + epsilon)
This limits batch-level advantage drift while the critic is imperfect. Tool observations are excluded, and critic return targets are computed before whitening and remain unchanged. Whitening complements a calibrated critic.
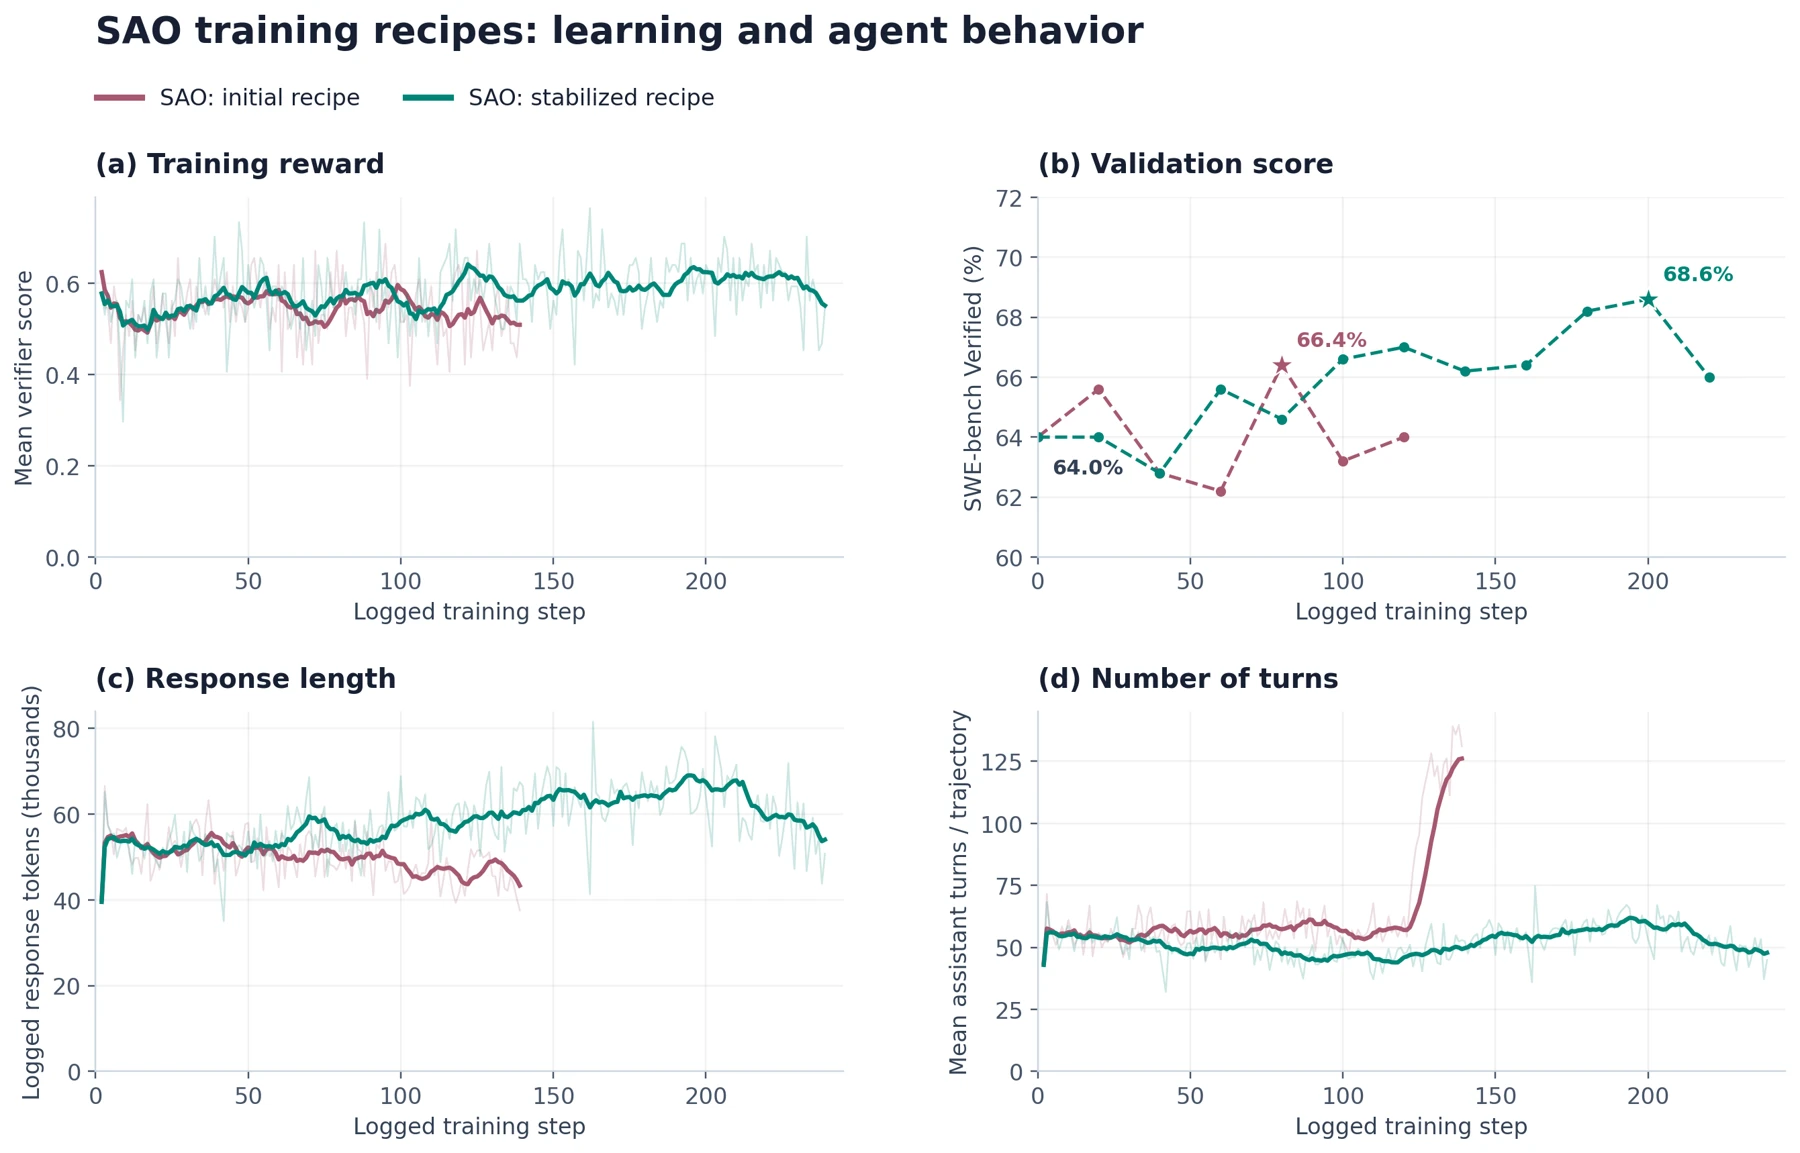
Figure 4. Initial and stabilized SAO recipes. Faint traces are observations; solid traces are ten-point means. Validation is unsmoothed, with a shared 64.0% base-model reference excluded from statistics.
Best validation rises from 66.4% to 68.6% over the stabilized recipe’s longer history. At common steps 120–139, mean turns fall from 109.5 to 49.1. The initial recipe still earns reward as its behavior deteriorates—a reason to monitor more than reward alone.
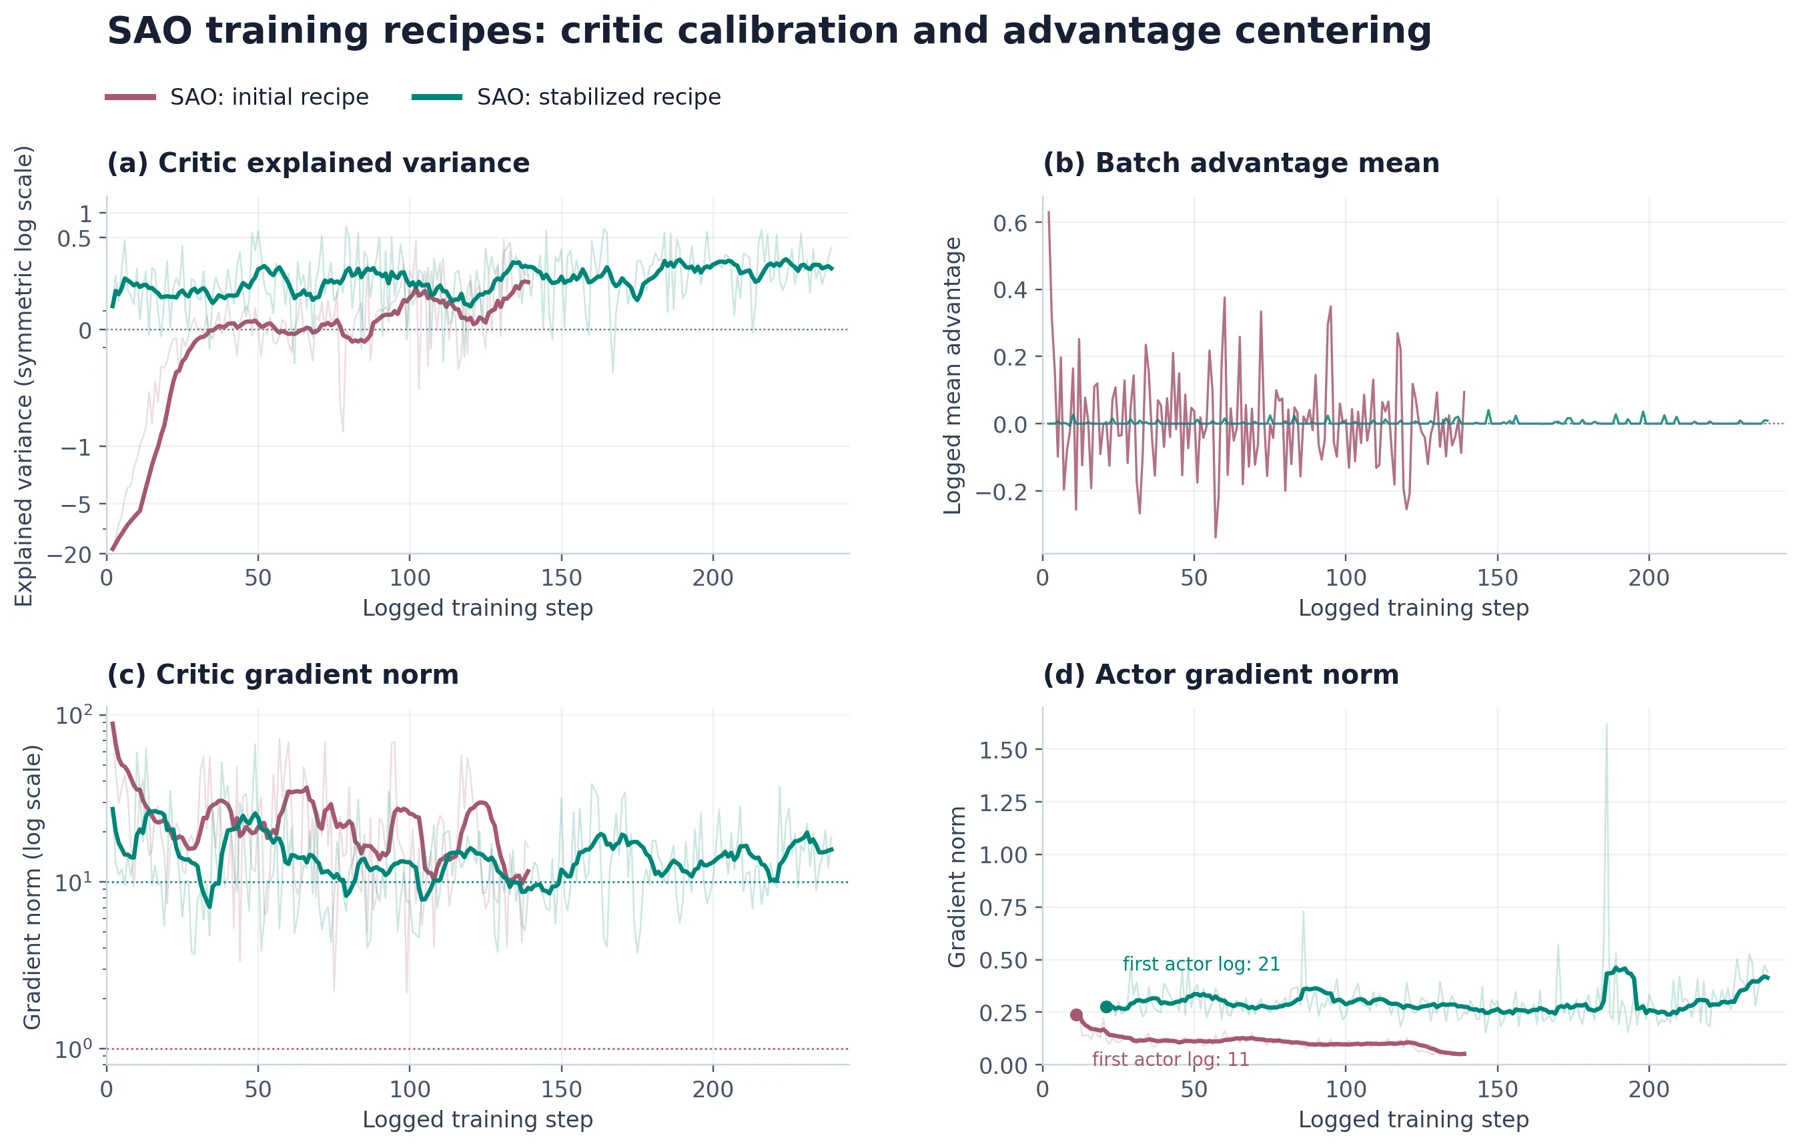
Figure 5. Critic and actor diagnostics. Explained variance uses a symmetric-log axis; advantage means are unsmoothed. Other curves use ten-point means. Dotted guides mark clipping thresholds of 1 and 10.
Does the recipe extend to other training settings?
SAO also learns on multilingual bugfix data and with three training harnesses. Both cases start from the same Qwen3.5-35B-A3B actor, use a trained critic and advantage whitening, and evaluate through OpenHands SDK on 300 SWE-bench Multilingual tasks.
| Setting | OpenHands SDK training | Three-harness mixed training |
|---|---|---|
| Training data | 1,729 multilingual bugfix tasks | 1,672 multilingual bugfix tasks + 2,327 OpenSWE tasks |
| Training harnesses | OpenHands SDK | OpenHands SDK, Claude Code, OpenCode |
| Validation harness | OpenHands SDK | OpenHands SDK |
| Actor PPO minibatch size | 64 | 128 |
| Critic initialization | Previously trained critic | Previously trained critic |
| Configured critic warmup | 2 steps | 20 steps |
| Advantage whitening | Enabled | Enabled |
| Best recorded Multilingual validation | 57.0% at logged step 90 | 61.67% at logged step 195 |
Table 4. Additional applications. Data, batch size, critic initialization, and training budget differ alongside harness selection.
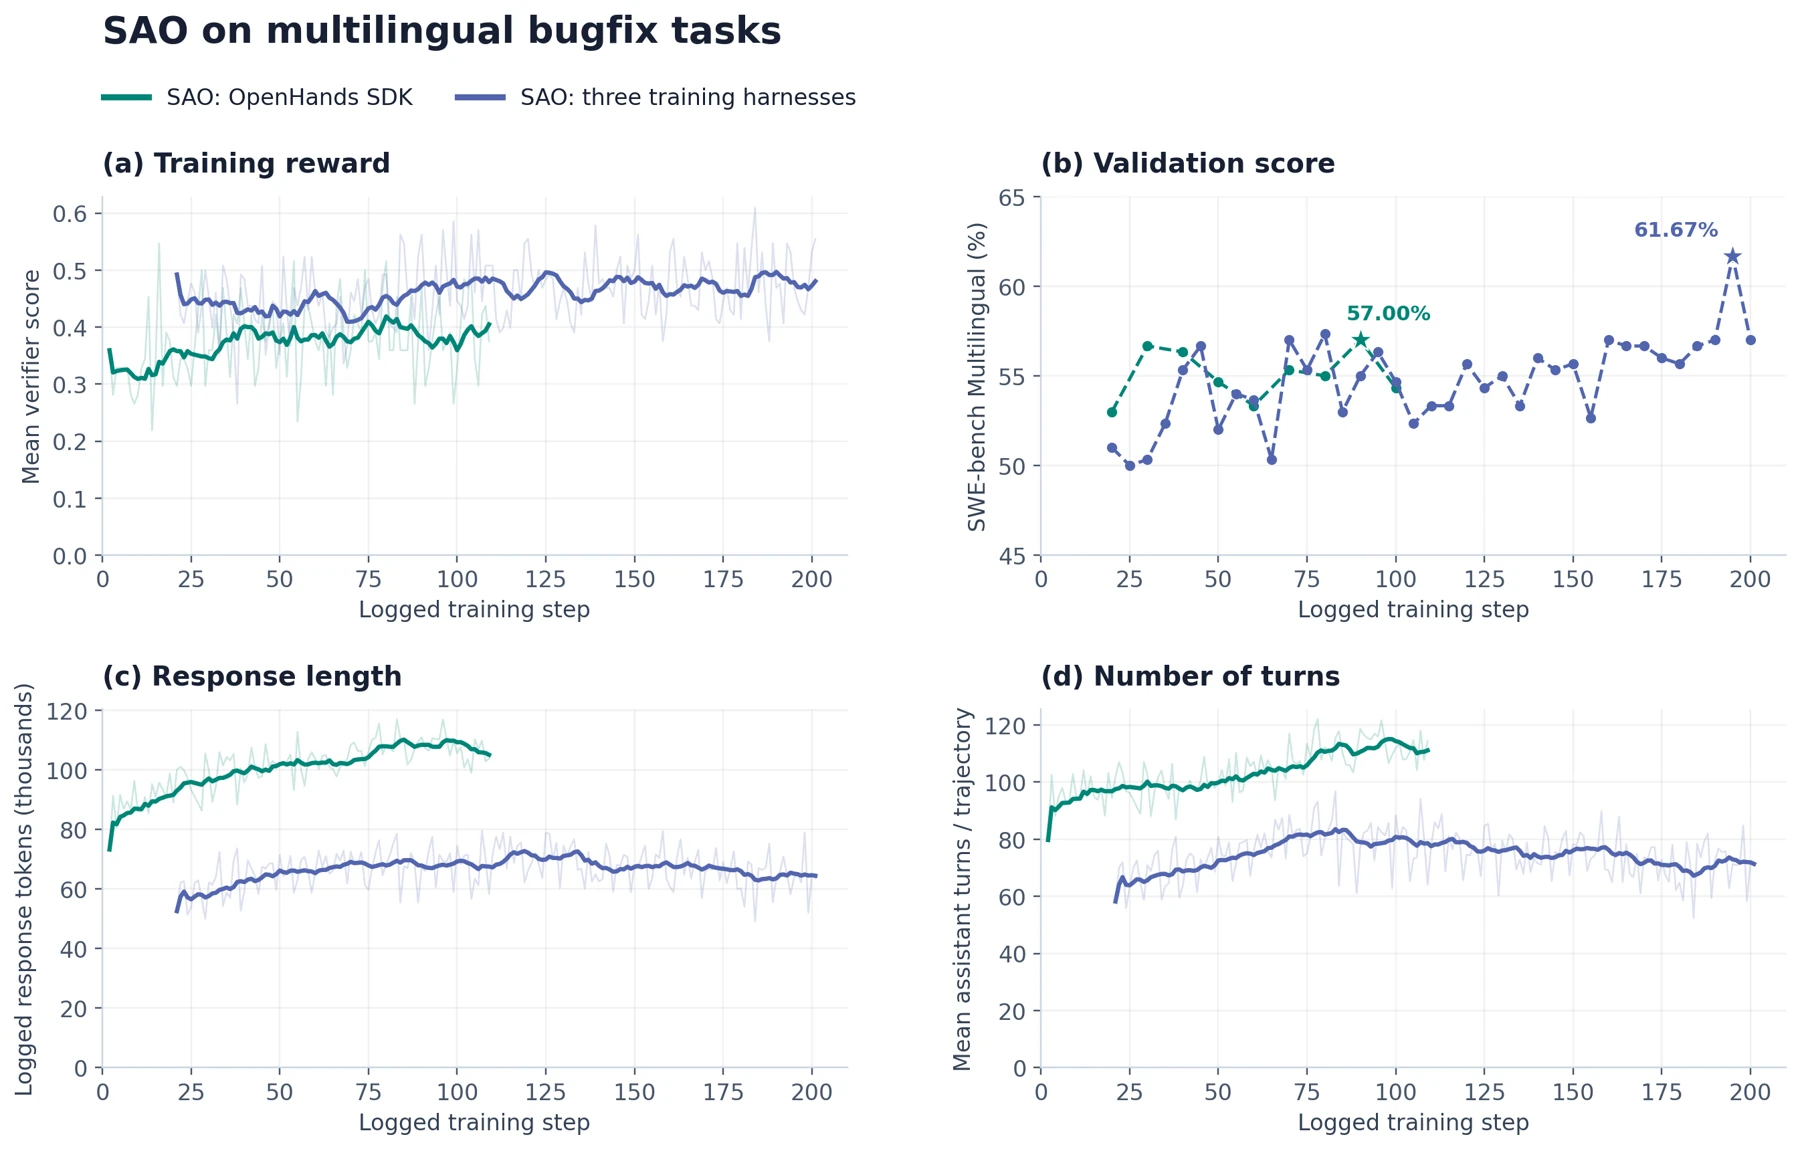
Figure 6. Observations and ten-point means; validation is unsmoothed, with stars at best checkpoints. Resumed OpenHands SDK sessions form one series. Mixed training starts at its first available observations.
With OpenHands SDK, validation rises from the first recorded 53.0% to a best 57.0%. Reward improves, but response length and turns also grow: single-rollout sampling does not inherently shorten trajectories. The final validation is 54.33%.
With OpenHands SDK, Claude Code, and OpenCode sampled at equal configured weights, validation reaches 61.67%, from a first available 51.0%. The final score is 57.0%; the last five evaluations average 57.6%.
These are additional applications, not a controlled test of harness mixing. Evaluation through Claude Code and OpenCode is still needed to establish gains on those interfaces.
What does a useful critic see along a trajectory?
A critic assigns different values to different token states within the same rollout. In the selected successful trajectory, values stay near one and rise later. In the failed trajectory, they fall toward zero. These patterns show how a value baseline can evolve as the agent works.
We inspect 40 pre-update traces from a separate OpenHands SDK experiment on the 3,999-task mixture: one sampled success and failure at each of twenty steps, totaling 959,418 model-action tokens. Tool observations inform the context but are excluded from the plotted tokens.
Two examples of the desired value pattern
We summarize the endpoint change as ΔV = V[last token] − V[first token], alongside first- and second-half means.
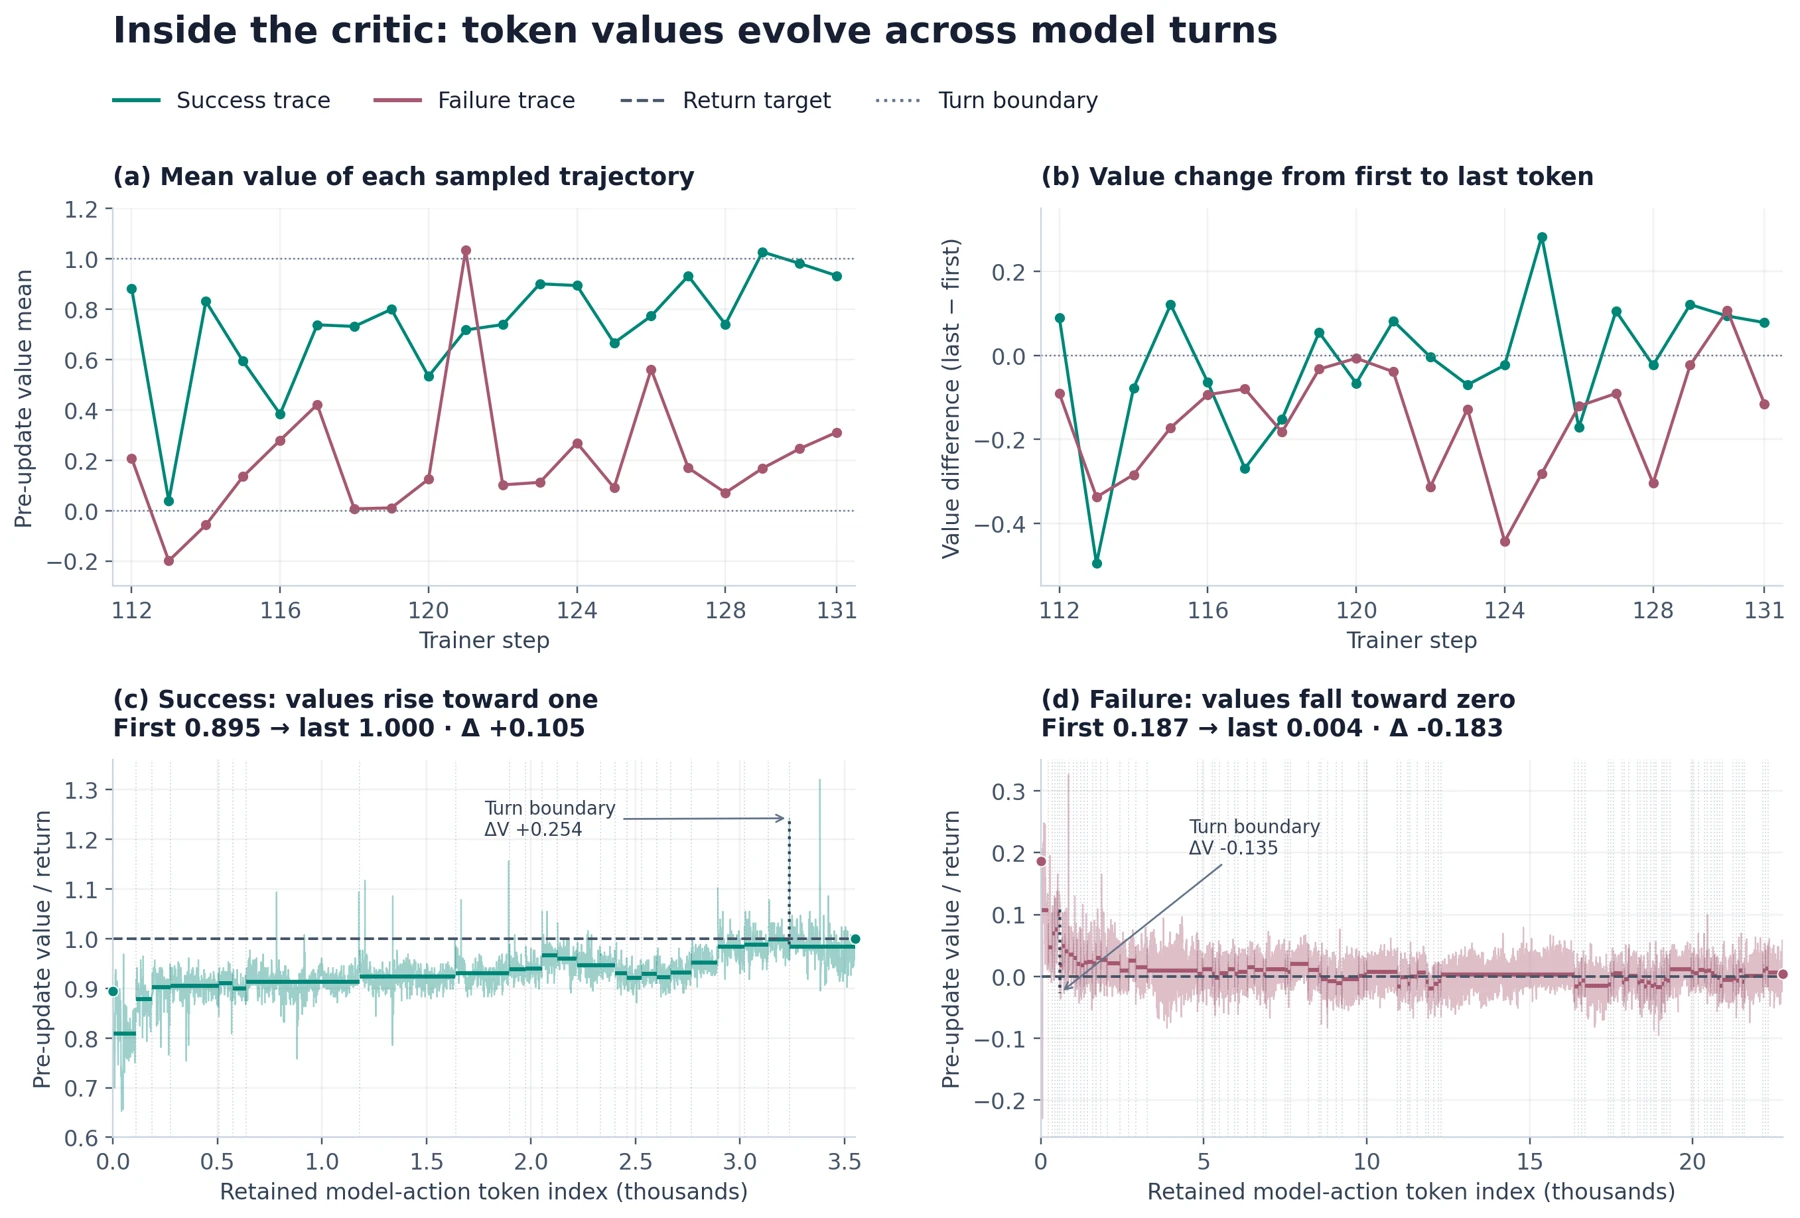
Figure 7. Top: mean value and last-minus-first difference for all 40 traces. Bottom: selected examples, with faint token values and thick per-turn means. Dotted lines mark message boundaries; arrows mark the largest boundary jumps. Dashed lines show return targets. The lower panels use different vertical scales.
| Diagnostic | Success example | Failure example |
|---|---|---|
| Retained model-action tokens | 3,552 | 22,773 |
| Return target | 1 | 0 |
| Mean token value | 0.932 | 0.007 |
| First token value | 0.895 | 0.187 |
| Last token value | 1.000 | 0.004 |
| Value difference (last − first) | +0.105 | −0.183 |
| First-half mean value | 0.9069 | 0.0143 |
| Second-half mean value | 0.9573 | −0.0005 |
Table 5. Selected examples, not group averages.
The success example rises from 0.895 to 1.000; its second-half mean is higher than its first-half mean. The failure example falls from 0.187 to 0.004, with its second-half mean near zero. Values can fluctuate or slightly exceed the target range because the critic output is unconstrained.
These are illustrative patterns, not a requirement that every trajectory be monotonic. Across the snapshot, success mean values exceed paired failure means in 19 of 20 cases; this outcome-selected comparison is not held-out classification accuracy.
Why do values jump at turn boundaries?
A new turn brings new context. Test results, command output, or other tool feedback can change the critic’s estimate before the next token is generated.
Large changes, defined as |ΔV| > 0.1, occur in 1.86% of boundary transitions versus 0.20% within turns—about 9.2× as often per transition. The highlighted examples jump by +0.254 and −0.135 at their respective boundaries.
The comparison covers 3,450 verified message-boundary transitions and 955,928 internal transitions. It shows an association with boundaries; identifying the cause of an individual jump requires the interaction log. Inspecting these token values complements aggregate critic metrics and makes value learning easier to diagnose.
What should we take away?
SAO makes one rollout per task a practical training choice for coding agents. In the OpenSWE comparison, it improves on the base model while using substantially fewer trajectories to its own best checkpoint. GSPO still reaches the higher Verified score.
The recipe depends on critic calibration and advantage whitening. Warm-start and warm up the critic, then track value quality together with reward, validation, response length, and turns. The additional multilingual cases show that this recipe can support more than one task distribution and training interface.
These results cover one model family without repeated-seed uncertainty. Time uses assumed concurrency scaling, the stabilization comparison changes several settings together, and multilingual cases have no GSPO control. Matched-concurrency runs and controlled ablations are the next tests for stronger efficiency and causal claims.
References
- Hou, Z., Li, Y., Tang, J., and Dong, Y. (2026). Single-Rollout Asynchronous Optimization for Agentic Reinforcement Learning. arXiv:2607.07508.
- Zheng, C., et al. (2025). Group Sequence Policy Optimization. arXiv:2507.18071.
- Shao, Z., et al. (2024). DeepSeekMath: Pushing the Limits of Mathematical Reasoning in Open Language Models. arXiv:2402.03300. Introduces GRPO.
- Schulman, J., et al. (2015). High-Dimensional Continuous Control Using Generalized Advantage Estimation. arXiv:1506.02438.
- Lego-RL contributors. SAO training documentation and experiment inventory.
- Lego-RL experiment records. Sources and processing notes, source manifest, and SAO training postmortem. Supporting benchmark results, training histories, and critic diagnostics.